Reports & Audit Guide
The Reports page (/reports) provides historical views of your security posture, operational metrics, sync activity, and a complete audit trail.
Tabs
Posture
The default view showing your workspace's security posture over time:
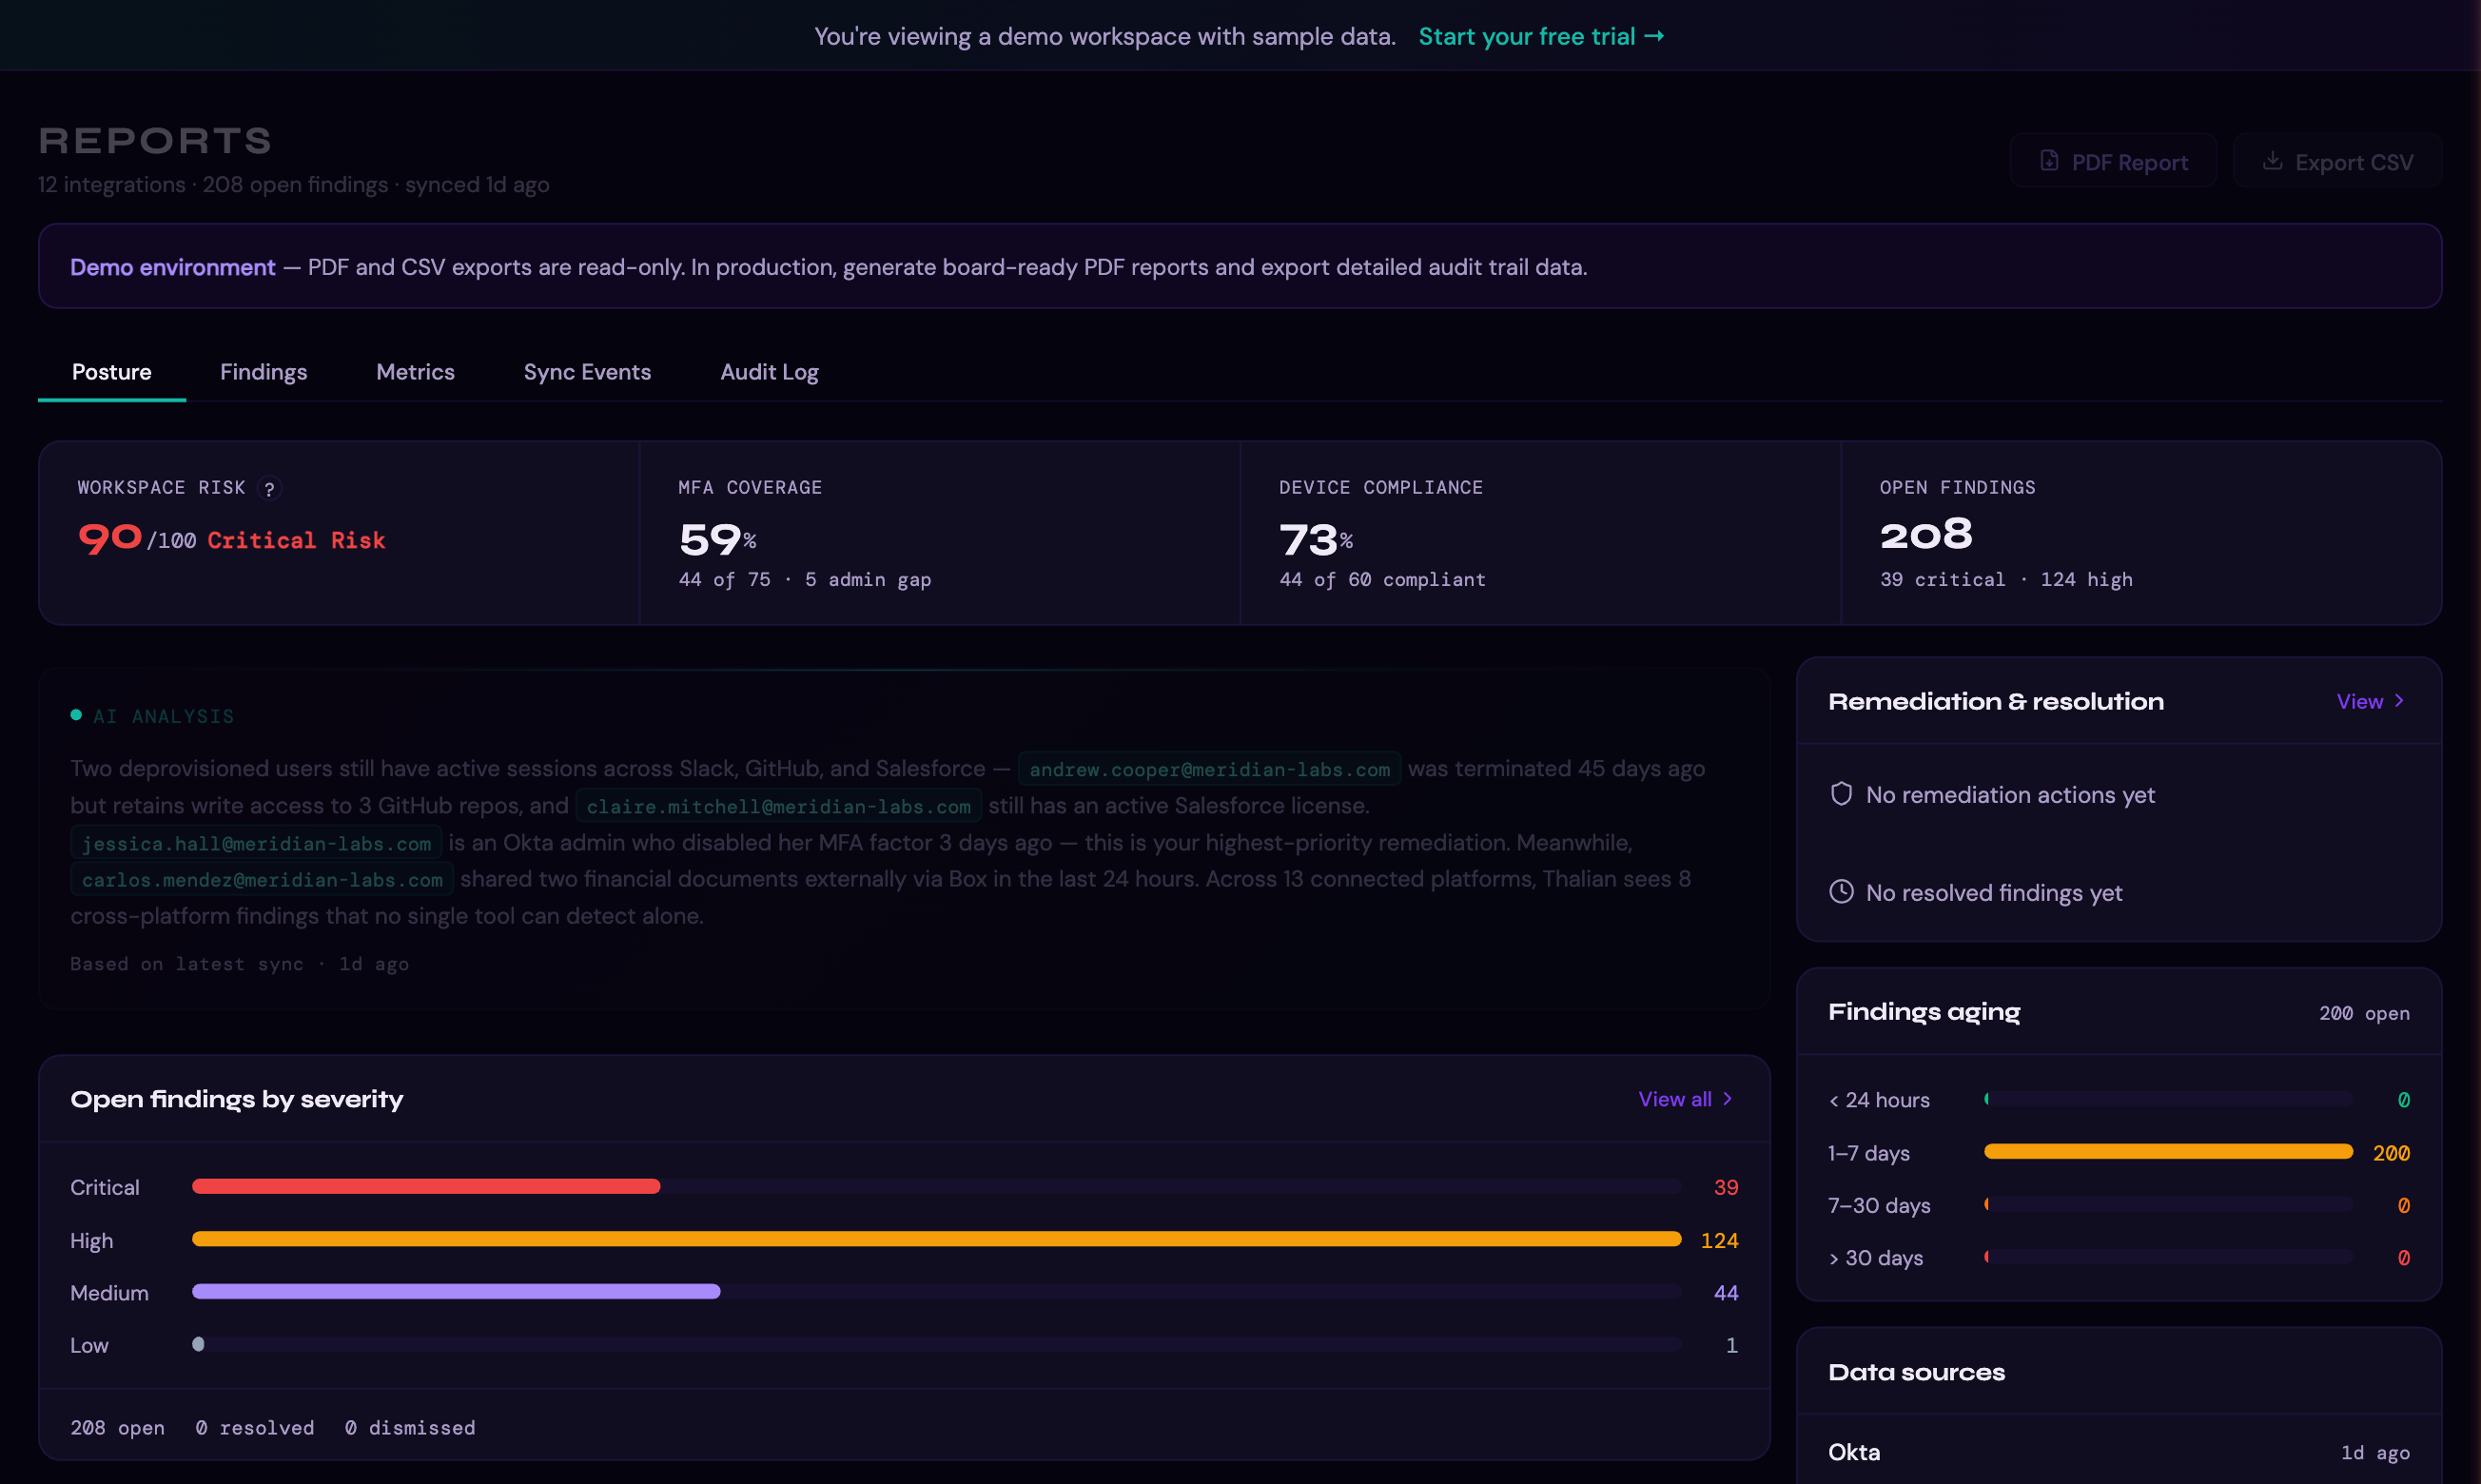
- Posture score trend: Historical risk score from drift snapshots, showing how your security posture has changed over time
- Findings breakdown: Open findings by severity and category
- Coverage metrics: MFA coverage, SSO adoption, device compliance percentages
- AI Brief: AI-generated summary of your current posture and notable changes. You can ask follow-up questions
Findings
A historical view of finding activity:
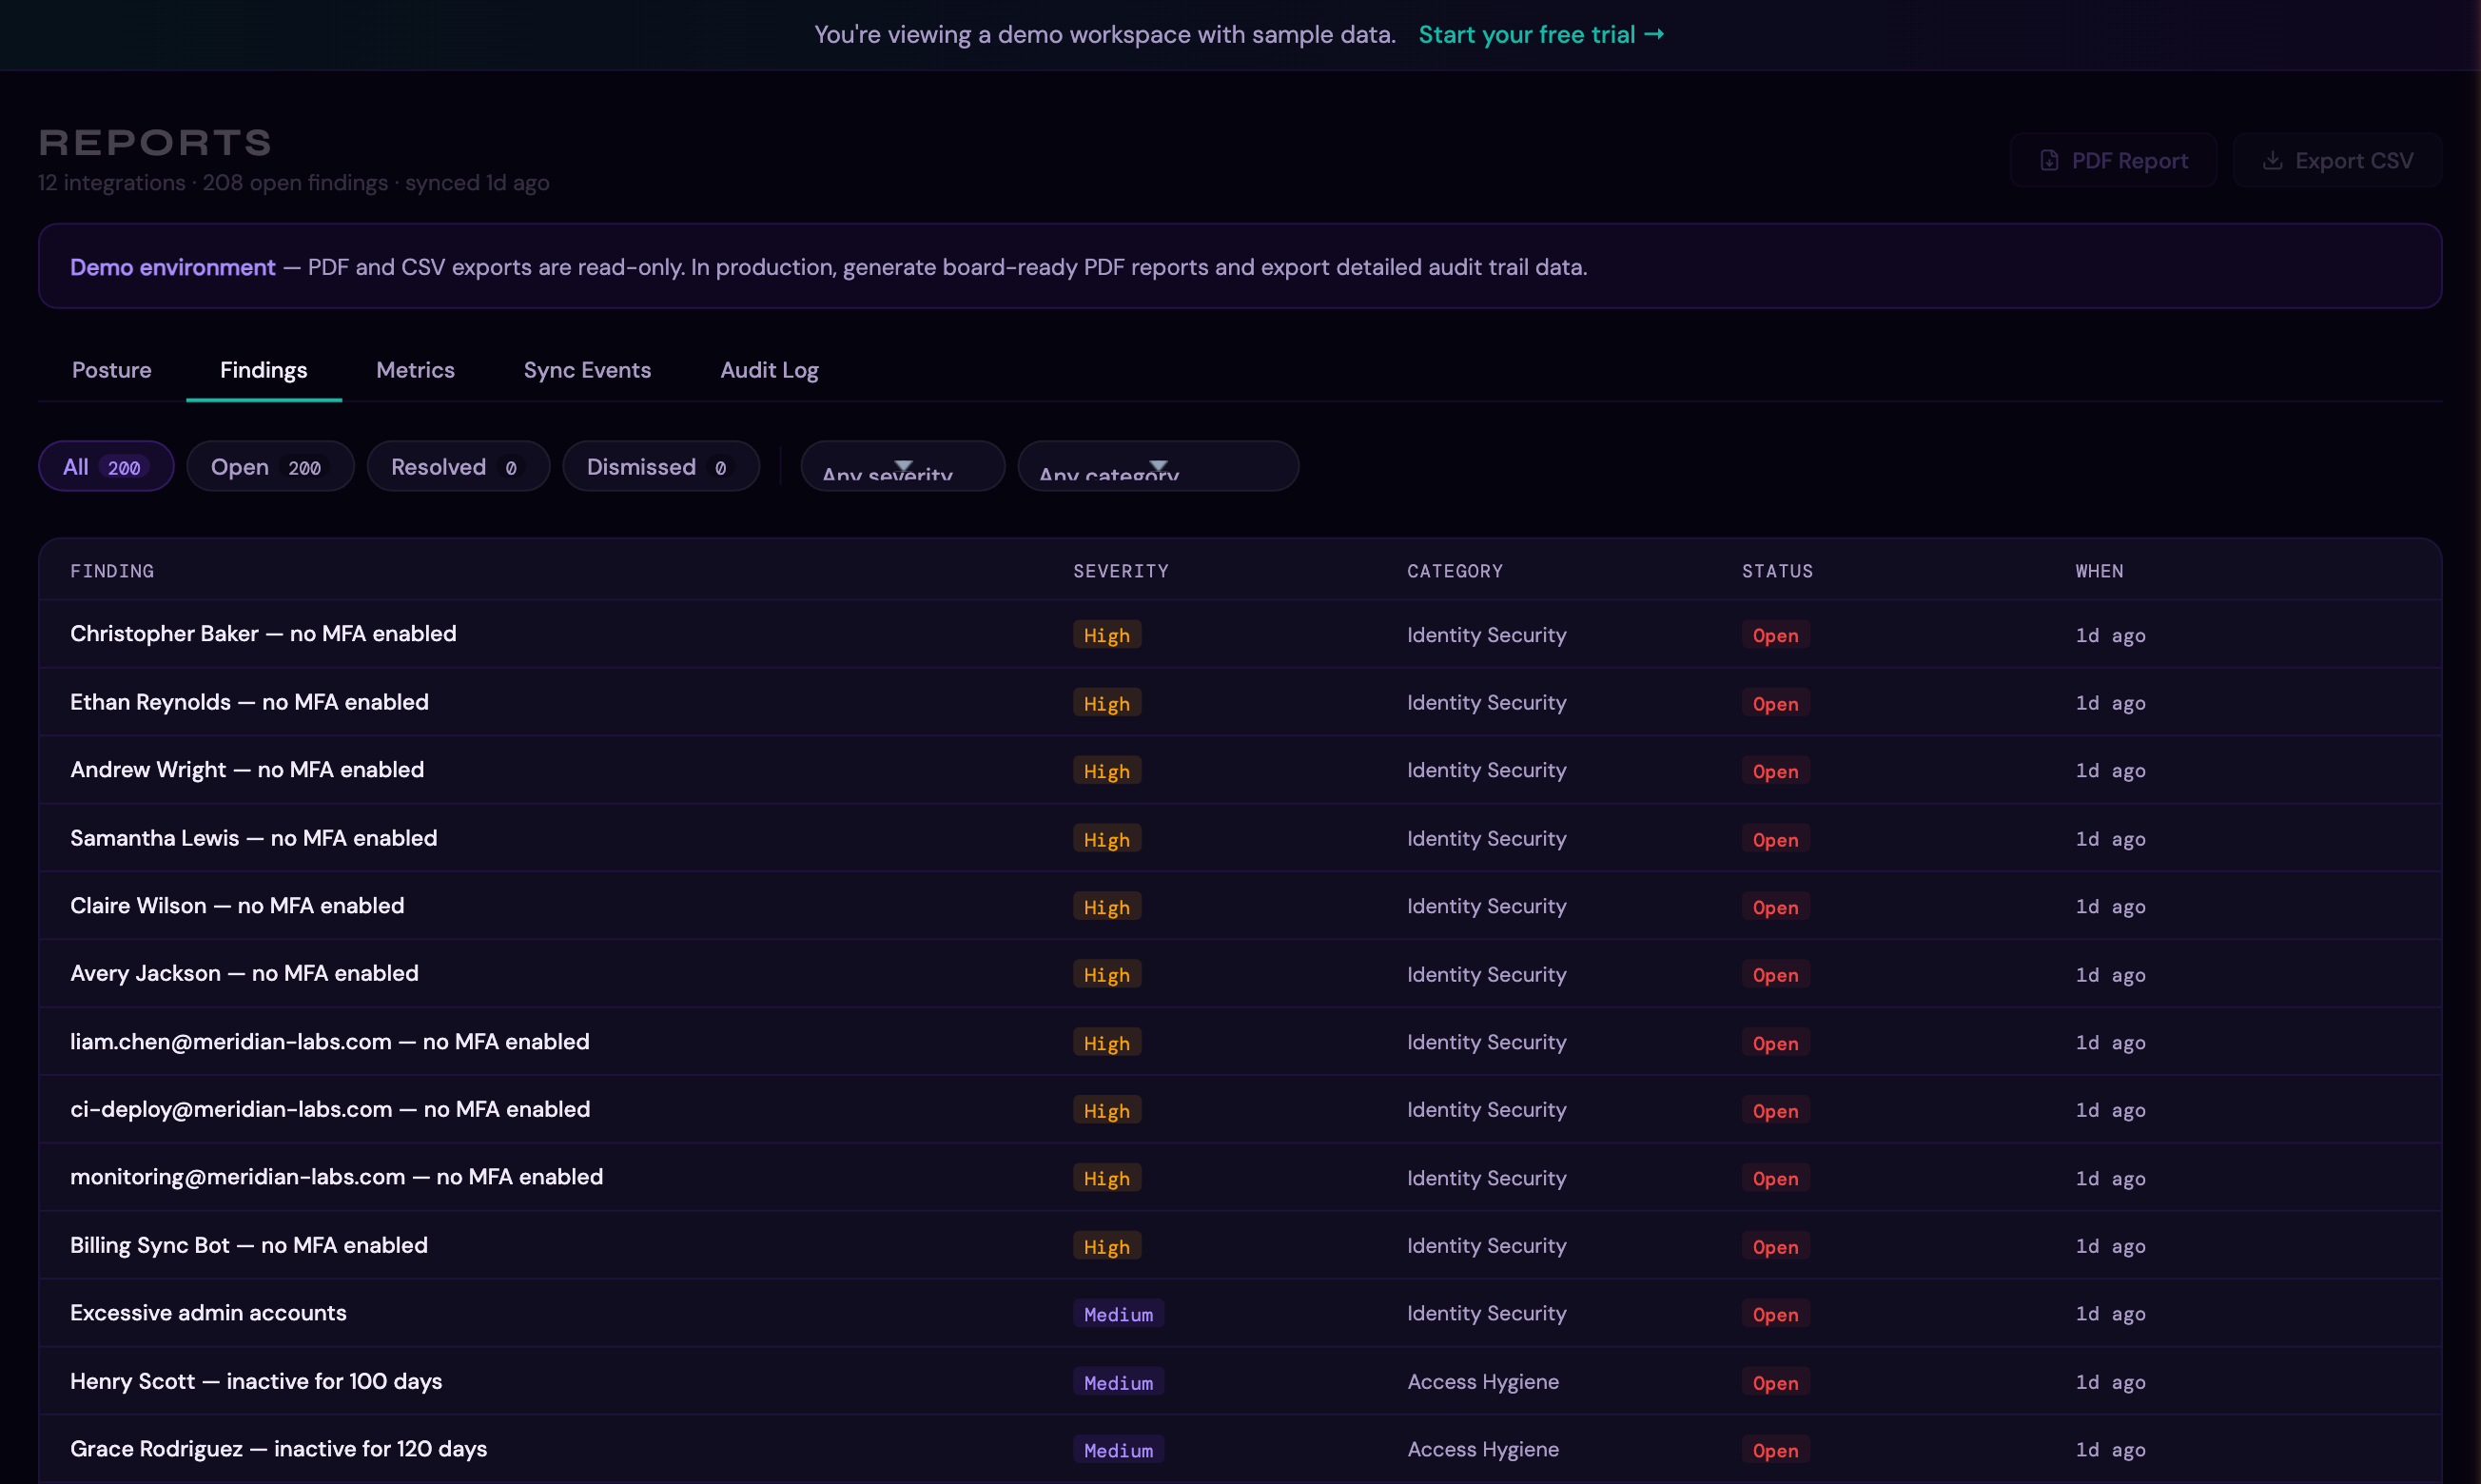
- Finding trends: New findings opened vs. resolved over time
- Category distribution: Which rule categories are generating the most findings
- Top recurring findings: Rules that fire most frequently
Metrics
Operational metrics for measuring IT security program effectiveness:
- MTTR (Mean Time to Remediate): Average time from finding detection to resolution
- Overall MTTR across all findings
- MTTR by severity (critical, high, medium, low)
- Trend over time from drift snapshots
- Remediation progress: Actions completed, pending, and failed
- Data source health: Integration sync status and freshness
Sync Events
A log of all data changes detected during syncs:
- Event types: Created, Updated, Deleted
- Entity types: Identity, Application, Device
- Details: What changed, on which platform, and when
- Filterable by event type and entity type
- Paginated for large datasets
Audit Log
Complete, immutable record of all actions taken in your workspace:
Logged action types: - Integration events (connected, disconnected) - Analysis runs (completed) - Remediation actions (requested, approved, rejected, executed) - App policy changes (sanctioned, blocked, cleared) - Finding status changes (resolved, dismissed) - Security settings (MFA enforcement, session timeout, IP allowlist) - Team management (invited, joined, role changed, removed) - Billing events (checkout, upgrade, cancellation, payment issues) - Google security events (RISC events)
Features: - Filter by category: All, Integrations, Remediation, Findings, Team, Billing, Settings, System, Security - Tamper-proof: Every entry is SHA-256 hashed for integrity verification - Export: Download the full audit log as JSON via the export button, for SIEM integration or compliance archival - Immutable: Audit log entries are never deleted, regardless of workspace plan or data retention settings. Minimum 365-day retention guaranteed
Executive PDF Report
The PDF Report button at the top of the Reports page generates a board-ready Executive Security Posture Report as a downloadable PDF, suitable for leadership review or audit distribution. It captures a point-in-time snapshot of your workspace:
- Posture grade: A letter grade (A through F) and your normalized risk score
- Findings by severity: Open critical, high, medium, and low counts
- Coverage metrics: MFA coverage, device compliance, encryption, and SSO coverage
- AI Governance Trajectory: Non-human identity trend lines with 30-day projections (see below)
- Remediation progress: Actions completed, pending, and failed
- Top open findings: The highest-severity open findings with category labels
- Connected integrations: The platforms feeding the report
AI Governance Trajectory
When your workspace has non-human identity (NHI) data, the report includes an AI Governance Trajectory section that projects how your AI exposure is trending. Three signals are tracked:
- Non-human identities: AI agents, bots, and service accounts
- AI governance findings: Open findings on the AI governance wedge
- Ungoverned / stale keys: API keys and tokens with no recent governance
Each signal shows its current count plus a 30-day projection derived from a least-squares fit over your drift snapshot history, so a steadily climbing population reads as 42 → 61 over 21d (▲ 45%) · ~78 in 30d. The section appears only when non-human identity data exists, and its projection matches the AI Governance Trajectory chart on the dashboard.
Risk Score Calculation
The risk score displayed on the dashboard and tracked in posture reports is calculated in two steps:
- Raw score:
(Critical findings × 10) + (High × 5) + (Medium × 2) + (Low × 1) - Normalized score:
round(raw / ceiling × 100), capped at 100
The ceiling is max(300, identityCount × 5) — a 60-identity workspace has a ceiling of 300; a 100-identity workspace has a ceiling of 500. This keeps the score meaningful at scale and prevents saturation. Only open findings (status: open or in_progress) are counted. Resolved and dismissed findings do not contribute to the score.
Drift Snapshots
After each analysis run, Thalian captures a "drift snapshot" — a point-in-time record of key metrics:
- Open finding counts by severity
- MFA coverage percentage
- Device compliance percentage
- Shadow IT count
- MTTR (overall and critical)
These snapshots power the trend charts and allow you to see exactly when posture changed and by how much.
AI Brief
Available on both the Dashboard and Reports pages, the AI Brief provides:
- Natural language summary of your workspace's security posture
- Highlights of notable changes since the last analysis
- Answers to follow-up questions about your data
The AI has access to your workspace's findings, identities, applications, devices, entitlements, and integration data. Ask questions like:
- "Which admins haven't logged in recently?"
- "What shadow IT apps were discovered this week?"
- "How has our MFA coverage changed over the past month?"
For information on setting security goals and tracking progress, see Policies & Impact Analysis.